We first need some data fit for a pie chart - a column for slice label, and a column for their (preferably relative) size.
d <-data.frame(Slices =c("Writing code", "Staring at plot", "Fixing code", "Enjoying plot") |>rep(2),Time =c(1, 5, 4, 2, 1, 1, 1, 2),When =c("Before reading this post", "After reading this post") |>rep(each =4)) |>transform(# Make time relativeTime_relative = Time /ave(Time, When, FUN = sum),Slices =factor(Slices, levels =unique(Slices)),When =factor(When, levels =unique(When)) )d
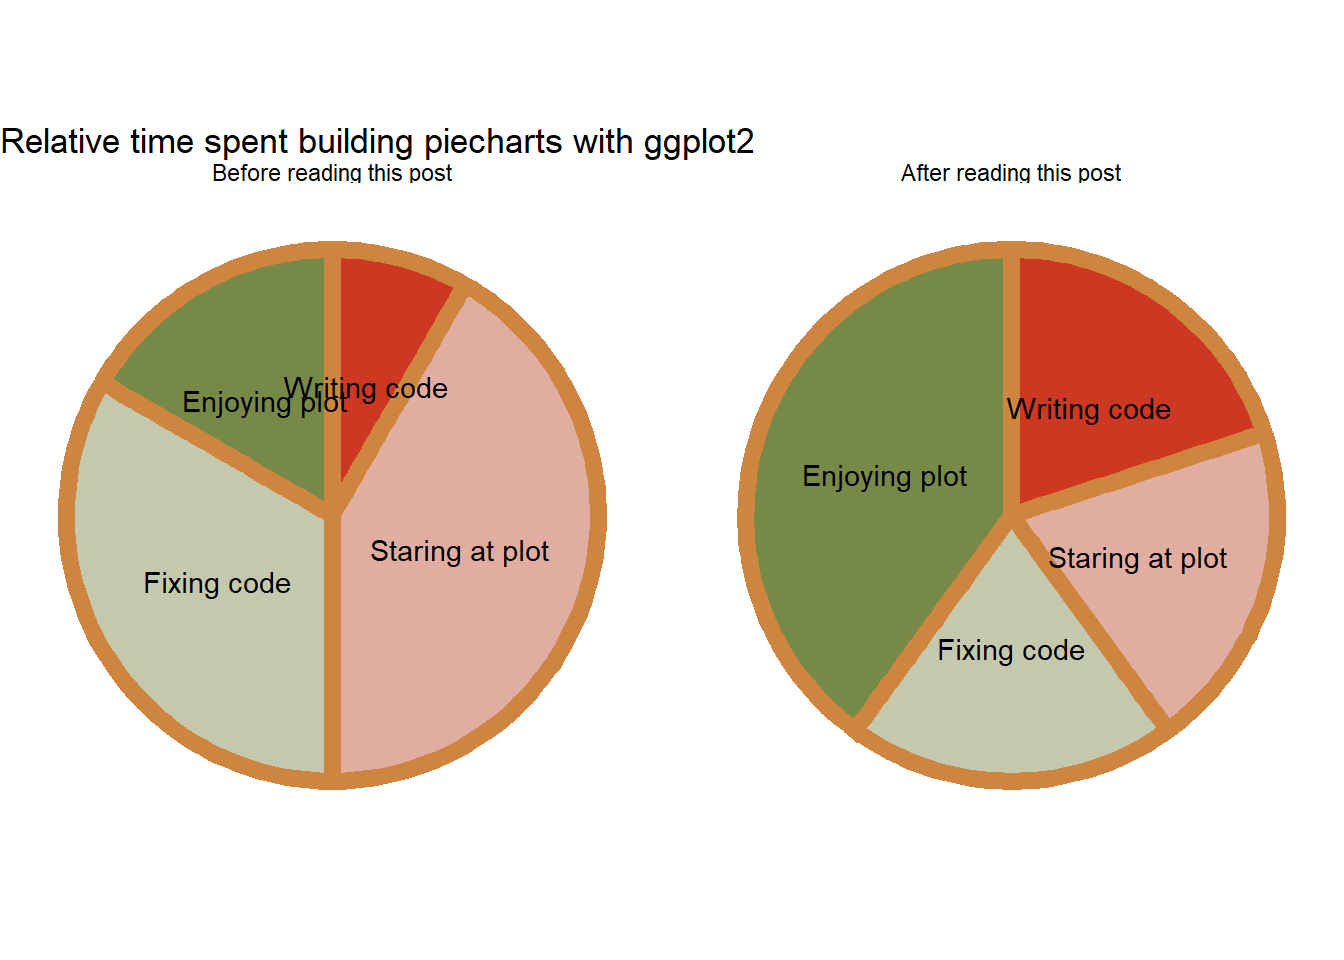
#>            Slices Time                     When Time_relative
#> 1    Writing code    1 Before reading this post    0.08333333
#> 2 Staring at plot    5 Before reading this post    0.41666667
#> 3     Fixing code    4 Before reading this post    0.33333333
#> 4   Enjoying plot    2 Before reading this post    0.16666667
#> 5    Writing code    1  After reading this post    0.20000000
#> 6 Staring at plot    1  After reading this post    0.20000000
#> 7     Fixing code    1  After reading this post    0.20000000
#> 8   Enjoying plot    2  After reading this post    0.40000000
Now let’s build the pie-chart!
library(ggplot2)ggplot(d, aes(x =1, y = Time_relative, fill = Slices)) +facet_grid(cols =vars(When)) +# Make piecoord_polar(theta ="y") +# Add the *stacked* columnsgeom_col(position =position_stack(reverse =TRUE), color ="tan3", linewidth =3, show.legend =FALSE) +# Add labels to the *stacked* position,# in the middle of the column (vjust = 0.5)geom_text(aes(label = Slices), position =position_stack(vjust =0.5, reverse =TRUE)) +# Make it a pizza pie! see::scale_fill_pizza_d() +theme_void() +labs(title ="Relative time spent building piecharts with ggplot2")